Project 07
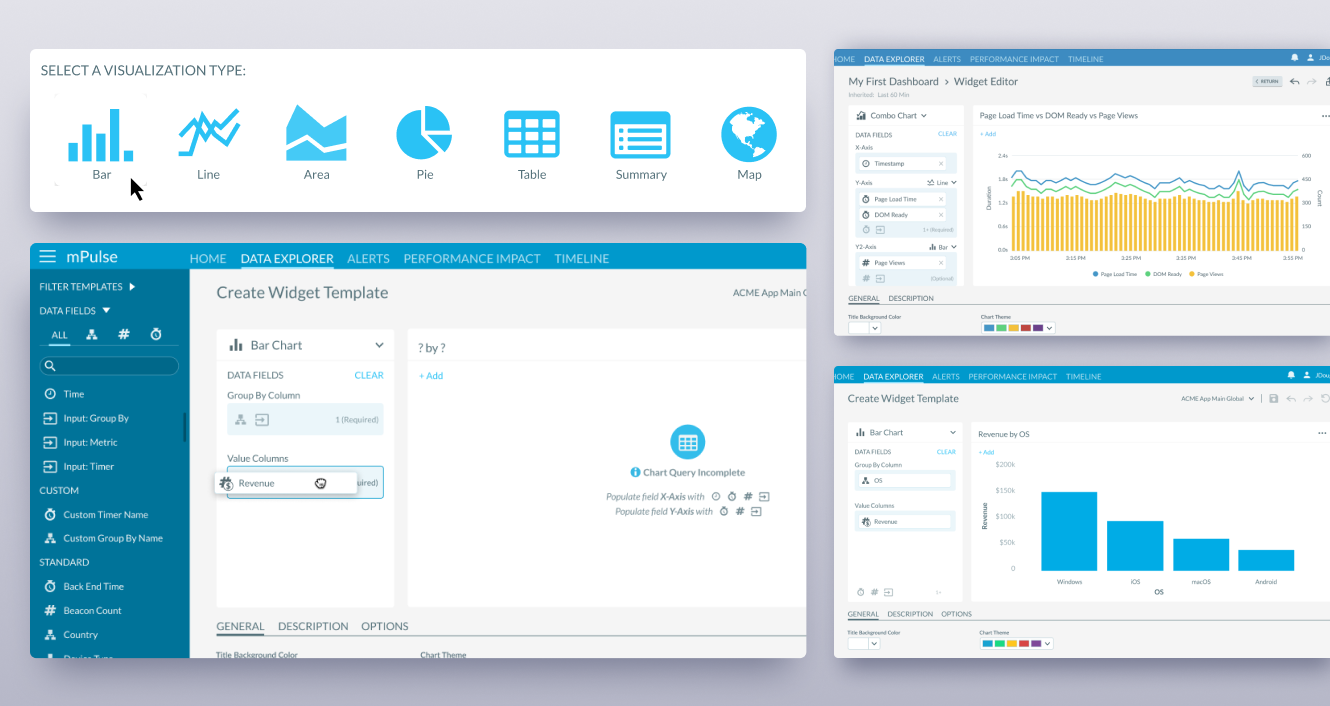
mPulse widget editor
A flexible editor for building dashboard visualizations without losing the context of the underlying data.
The challenge
mPulse users needed to build custom data visualizations from a large collection of metrics, dimensions, and timers. The editor had to provide deep customization for advanced users while remaining approachable for people creating simpler widgets.
The approach
Following stakeholder interviews and workflow reviews, I designed a progressively disclosed, drag-and-drop experience. Searchable data categories, live chart previews, flexible chart types, and contextual settings allowed users to experiment quickly without exposing every advanced option at once.
The result
The widget editor transformed a manual configuration process into a flexible, interactive workflow. Users could create and refine visualizations more efficiently, giving performance teams more time to interpret their data instead of configuring dashboards.