Project 04
mPulse Data Explorer
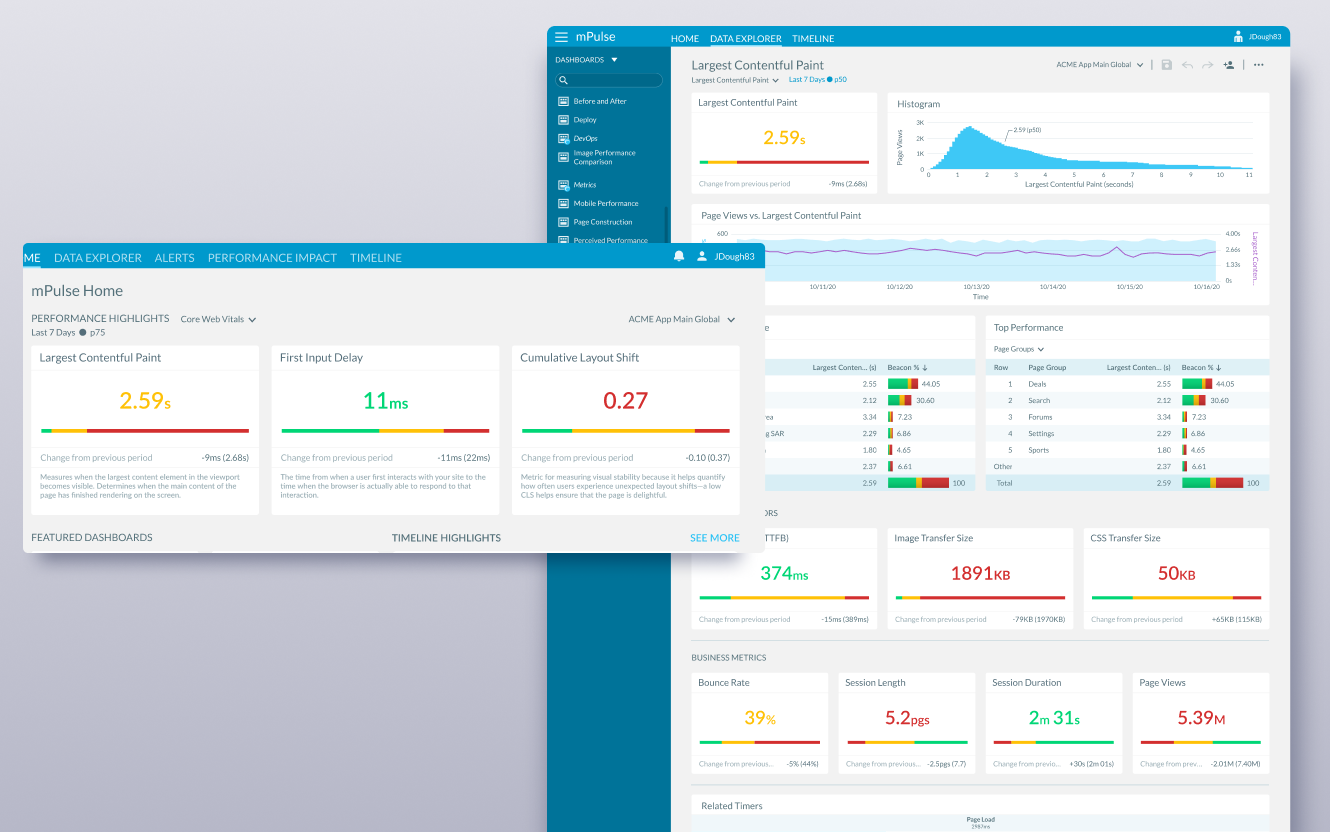
An analytics workspace that helps teams investigate performance data and understand what is affecting real users.
The challenge
The existing Data Explorer had fragmented navigation, an outdated interface, and important features hidden in unintuitive locations. New requirements also called for dynamic navigation between related data points without making an already complex analytics experience more difficult to use.
The approach
I interviewed stakeholders, reviewed contemporary dashboard patterns, and iterated on a new information architecture and interface. The redesigned experience streamlined dashboard creation and introduced interactive drill-downs that helped users move between related metrics and uncover correlations.
The result
The new Data Explorer made complex performance data easier to navigate and received positive feedback from users. It also established a more modern and scalable foundation for future dashboard and data-exploration capabilities.
Client feedback
mPulse is like Google Analytics on steroids. It puts all the numbers I need at my fingertips in visual dashboards, providing a complete picture of what is happening with site visitors.